Analyzing tabular data with pandas
featuring the human proteome
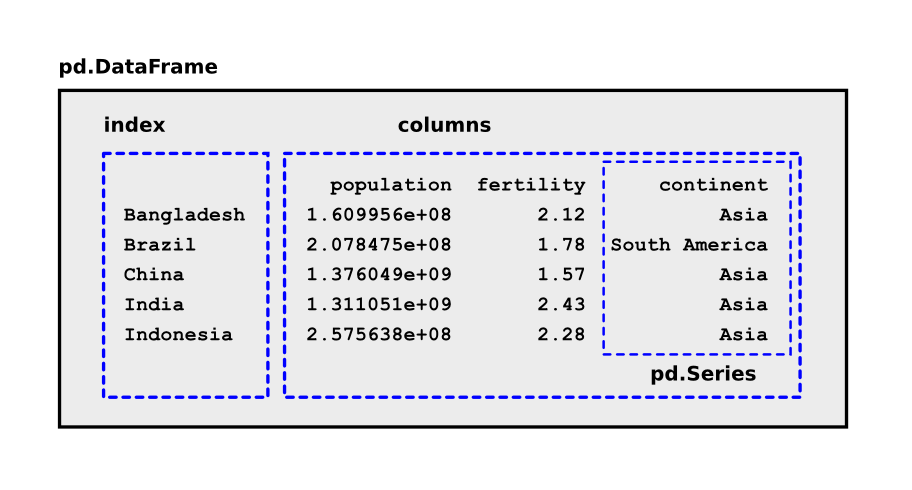
pandas
Pandas is the de-facto standard to read, analyze and visualize tabular data from CSV files, Excel tables and many more.
The main data structure for tables is called DataFrame:
Installing pandas
pip install pandas
pip install matplotlib
Your Task
- Make sure you have the file
human_proteome.csv. - Execute the paragraphs below in an interactive Python console.
- Find out what each code segment does.
Exercise 1
import pandas as pd
import pylab as plt

df = pd.read_csv('human_proteome.csv', index_col=0)
df.head()
Exercise 2
df['name']
df[['name', 'length']]
Exercise 3
df.sum()
Exercise 4
df['W'].mean()
df['W'].std()
Exercise 5
df.describe()
Exercise 6
df[df['length'] > 5000]
Exercise 7
df.sort_values('length', ascending=False).head(10)
Exercise 8
df['H_percent'] = df['H'] / df['length']
df.sort_values('H_percent', ascending=False).head(20)
Exercise 9
def match_name(name, query):
    return query in name

hemo = df['name'].apply(match_name, args=["Hemoglobin"])
df[hemo]
Exercise 10
df.plot.scatter('K', 'R')
plt.axis([0, 1000, 0, 500])
plt.savefig('scatterplot.png')
Exercise 11
plt.figure()
short = df[df['length'] < 1000]
short['length'].hist(bins=50)
plt.savefig('lengths.png')
Where to learn more?
- on the pandas homepage
- in the book Python for Data Analysis